


Did you know 86% of customers are willing to pay more for a great customer experience? That’s how important meaningful interactions are. On social media, every like, comment, or share is more than just a number—it’s a chance to connect, build trust, and show your audience you’re paying attention.
Understanding how your audience engages with your content helps you strengthen those connections and maximize your approach. When you focus on the right social media metrics, you can uncover what’s working, find areas for improvement, and create a strategy that truly resonates.
With all that in mind, let’s get into the most important engagement metrics for social media.
What is Social Media Engagement?
Social media engagement is all about how people respond to what you post. Whether they’re liking, commenting, sharing, or clicking a link, every interaction tells you they’re paying attention to your content.
What really matters isn’t just how many people interact but how meaningful those interactions are. A genuine comment or a share that introduces your post to a wider audience often means more than a bunch of quick likes.
By tracking these responses, you get a better idea of what your audience enjoys and how you can keep them interested.
Social Media Engagement Metrics You Need to Track
Tracking the right social media metrics gives you a clear picture of how your content performs. Let’s break down the essential categories.
Awareness Metrics
Awareness metrics show how visible your content is to your audience. They help you understand whether your social media posts are reaching enough people and grabbing attention.
1. Engagement Rate
Engagement rate can tell you how much your audience is interacting with your content relative to how many users see it.
It’s a helpful way to gauge how well your posts are connecting with your followers. Are they liking, commenting, or sharing? Or are they just scrolling past? A higher engagement rate means people are interested and finding value in what you’re sharing.
Keeping an eye on this metric helps you figure out what works best, so you can create more content that gets people involved and keeps them coming back for more.
2. Impressions and Reach
Impressions and reach are your go-to metrics for checking content visibility. Impressions count how many times your post is shown—whether it’s the same person seeing it multiple times or different people altogether.
Reach, on the other hand, focuses on unique viewers. Together, these metrics give you a clear picture of how far your content is spreading. If your reach is high but engagement is low, it might be time to rethink your social strategy.
3. Follower Growth
Follower growth measures how your audience is growing over time, and it’s a great way to see if your content is attracting attention.
But don’t get too hung up on numbers—what really matters is having engaged followers who interact with your posts.
Are you gaining new followers after posting a specific type of content? Are people sticking around? These are the kinds of questions follower growth can help you answer.
4. Social Share of Voice (SSoV)
Social Share of Voice shows you how much people are talking about your brand compared to your competitors. It’s like a popularity check for your social media presence. By tracking mentions, hashtags, and tags, SSoV gives you a sense of your brand’s share in industry conversations.
If your SSoV is growing, it means more people are noticing and engaging with your content. It’s also a handy way to spot areas where your competitors might be gaining ground. Monitoring this metric helps you stay relevant and find opportunities to stand out in your market.
Conversion Metrics
Conversion metrics can show how well your social media efforts are influencing actions like purchases or downloads. These metrics help you understand if your content is inspiring people to take the next step and engage with your business in a meaningful way.
5. Conversion Rate
The conversion rate shows the percentage of people who complete an action after interacting with your content.
It’s one of the most important metrics for measuring success because it directly ties engagement to results. A higher conversion rate means your content, messaging, and calls-to-action are working well.
Examples of conversions include:
- Signing up for a newsletter
- Purchasing a product
- Registering for a webinar
- Downloading a whitepaper
By keeping an eye on this metric, you can identify what motivates your audience and fine-tune your strategy for better results.
6. Click-Through Rate (CTR)
Click-through rate is all about how often people click on a link in your post compared to how many see it. It’s a great way to measure interest in your content. A strong CTR means your headline or call-to-action is grabbing attention and driving people to learn more.
If your CTR is low, consider reworking your captions or graphics to make your posts more appealing.
Experimenting with different approaches, like asking a question or using curiosity-driven language, can help improve performance and get more people clicking through to your website or landing page.
7. Cost Per Conversion (CPC)
Cost per conversion measures how much you’re spending to get someone to take a specific action. This metric is essential for tracking the effectiveness of your ad campaigns and making sure you’re getting a good return on your investment.
A lower CPC means your social media campaigns are reaching the right people and encouraging them to act without overspending. If your costs are high, it’s worth reviewing your targeting, creative elements, or even the offer itself to optimize results.
8. Bounce Rate
Bounce rate tracks the percentage of people who leave your site without taking any action after clicking your social media links. A high bounce rate often indicates a mismatch between your post and the landing page.
For example, if your post promises a free guide but your landing page doesn’t clearly deliver that, visitors may leave quickly.
Improving bounce rate means creating a smoother journey for your audience, where your posts and landing pages align seamlessly. A lower bounce rate suggests your content is meeting expectations and holding your audience’s attention.
Customer Service Metrics
Customer service metrics measure how well you’re supporting your audience and addressing their needs on social media. These metrics highlight how quickly and effectively your team handles questions, concerns, or feedback.
Great customer service builds trust, loyalty, and long-term relationships, so keeping an eye on these numbers is key to creating a positive experience for your audience.
9. Customer Satisfaction Score (CSAT)
CSAT is a quick way to measure how happy people are with your service. After interacting with your brand, customers are usually asked to rate their experience on a scale—often from “very dissatisfied” to “very satisfied.”
If your CSAT is high, it means you’re doing a good job meeting your audience’s expectations. A low score, on the other hand, signals that improvements are needed. Asking for feedback and acting on it shows customers you value their input, which can boost satisfaction over time.
10. Net Promoter Score (NPS)
Net Promoter Score measures how likely customers are to recommend your brand to others. It’s usually based on a simple question: “How likely are you to recommend us to a friend or colleague?”
NPS divides customers into three groups: promoters, passives, and detractors. A high NPS means people trust your brand enough to promote it, which is a strong indicator of loyalty.
Tracking this metric helps you identify areas for improvement and find opportunities to turn more customers into loyal advocates.
11. Customer Sentiment
Customer sentiment analyzes the tone of what people are saying about your brand on social media. It’s about understanding whether mentions and comments are positive, neutral, or negative.
For instance, are people praising your products or complaining about delivery delays? Sentiment analysis tools can help you identify trends and spot issues early.
Responding thoughtfully to feedback—especially negative comments—shows your audience that you’re listening and willing to make changes when needed.
12. Average Response Time
Average response time tracks how quickly your team replies to questions or comments on social media. People expect fast responses, so this metric is crucial for creating a good impression.
If your response time is quick, it shows customers you’re paying attention and prioritizing their needs. Slow response times, however, can leave customers feeling ignored.
Regularly reviewing this metric and aiming to respond within an hour (or less) can make a big difference in how your brand is perceived.
Media Metrics
Media metrics help you understand how your visual and video content performs on social media. These metrics reveal what grabs your audience’s attention and keeps them engaged, which allows you to fine-tune your strategy for better results.
13. Story Completion Rate
Story completion rate measures how many people watch your social media stories all the way through. It’s a great indicator of how engaging and relevant your stories are. If your completion rate is high, it means viewers are interested enough to stick around until the end.
To improve this metric, focus on creating concise, visually appealing stories that flow naturally. Using clear calls-to-action, such as “Swipe up” or “Tap to learn more,” can also keep viewers engaged.
Experimenting with different formats—like polls, Q&A stickers, or quick tutorials—can make your stories even more interactive and fun to watch.

14. View Count
View count is one of the simplest metrics to track, showing how many times people have watched your video content. Whether it’s a short reel or a longer video, this metric tells you if your content is catching attention.
However, not all views are equal. Some platforms count a view after just a few seconds, so it’s important to pair this metric with others, like video completion rate, to get a fuller picture.
If your view count is low, think about tweaking your thumbnails, captions, or video topics to grab attention faster.
15. Video Completion Rate
Video completion rate shows what percentage of viewers watched your video from start to finish. It’s a key indicator of how engaging your content is. A high completion rate means your video held the audience’s interest, while a low rate suggests people lost interest partway through.
To boost this metric, keep your videos focused and to the point. Start strong to grab attention right away, and avoid filler content that might cause viewers to drop off. Including subtitles can also help, especially for viewers who scroll without sound.
16. Watch Time
Watch time tracks the total amount of time viewers spend watching your videos. It’s a valuable metric because platforms like YouTube and Instagram often prioritize content with higher watch times. If people are sticking around, it’s a sign your videos are providing real value.
To improve watch time, consider creating longer videos that dive deeper into topics your audience cares about. Make sure your content has a logical flow, with strong transitions to keep viewers engaged.
17. Top Performing Content
Top-performing content refers to the posts, videos, or stories that generate the most engagement, views, or conversions. By identifying your best-performing pieces, you can learn what resonates with your audience and replicate that success in future posts.
To find your top content, review your analytics and look for patterns. Is it a specific type of post, like tutorials or inspirational quotes? Once you know what works, you can build on those strengths.
How to Build an Engagement Analytics Workflow
Creating a structured engagement analytics workflow is a must for staying on top of your social media performance.
Without a clear process, it’s easy to get overwhelmed by the sheer amount of data available—likes, comments, shares, impressions, and more. This can leave you guessing which metrics matter most or how to turn those numbers into actionable steps.
A well-organized workflow eliminates that confusion so you can focus on what drives real results and empowers you to make informed, data-driven decisions.
Here’s a step-by-step guide to setting up an engagement analytics workflow that simplifies the process and keeps you in control:
Define Your Goals
Before diving into the numbers, take a moment to figure out what you really want to achieve. Without clear goals, it’s easy to get lost in all the data and end up tracking metrics that don’t actually matter to your success.
What’s your main focus? Are you trying to grow your audience and gain more followers? Maybe you want to see better engagement, like more comments and shares, on your posts. Or perhaps your goal is to drive conversions—getting people to sign up for something, make a purchase, or visit your website.
Once you’ve nailed down your goals, it becomes much easier to decide what to track. For instance, if audience growth is your aim, keep an eye on follower growth and reach. If it’s about engagement, focus on likes and shares.
Knowing exactly what you want helps you zero in on the numbers that matter and align your efforts with your strategy.
Select the Right Tools
Having the right tools makes a big difference when it comes to tracking your social media performance. Trying to manage multiple platforms or data manually can get messy fast. A good tool keeps everything organized and gives you the valuable insights you need to focus on what really matters.
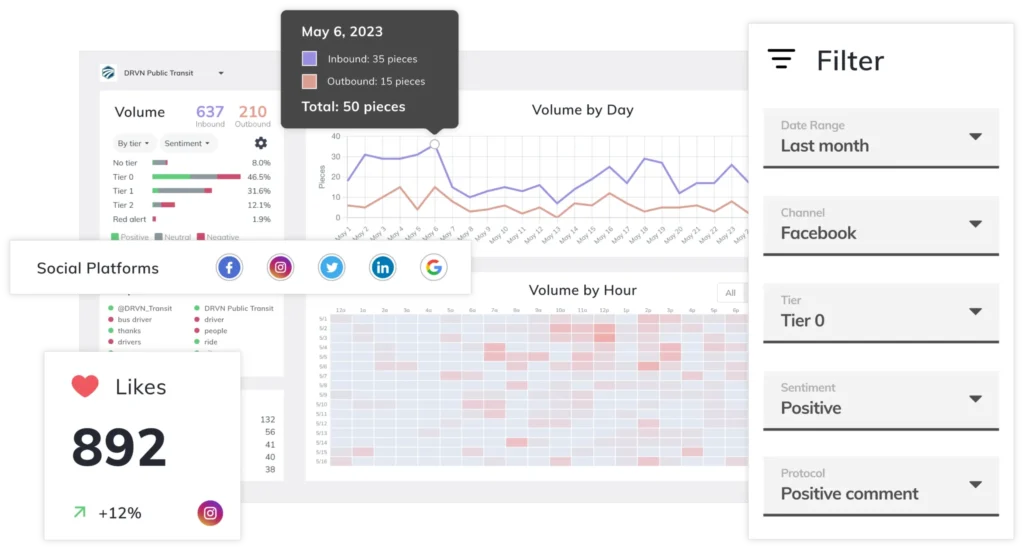
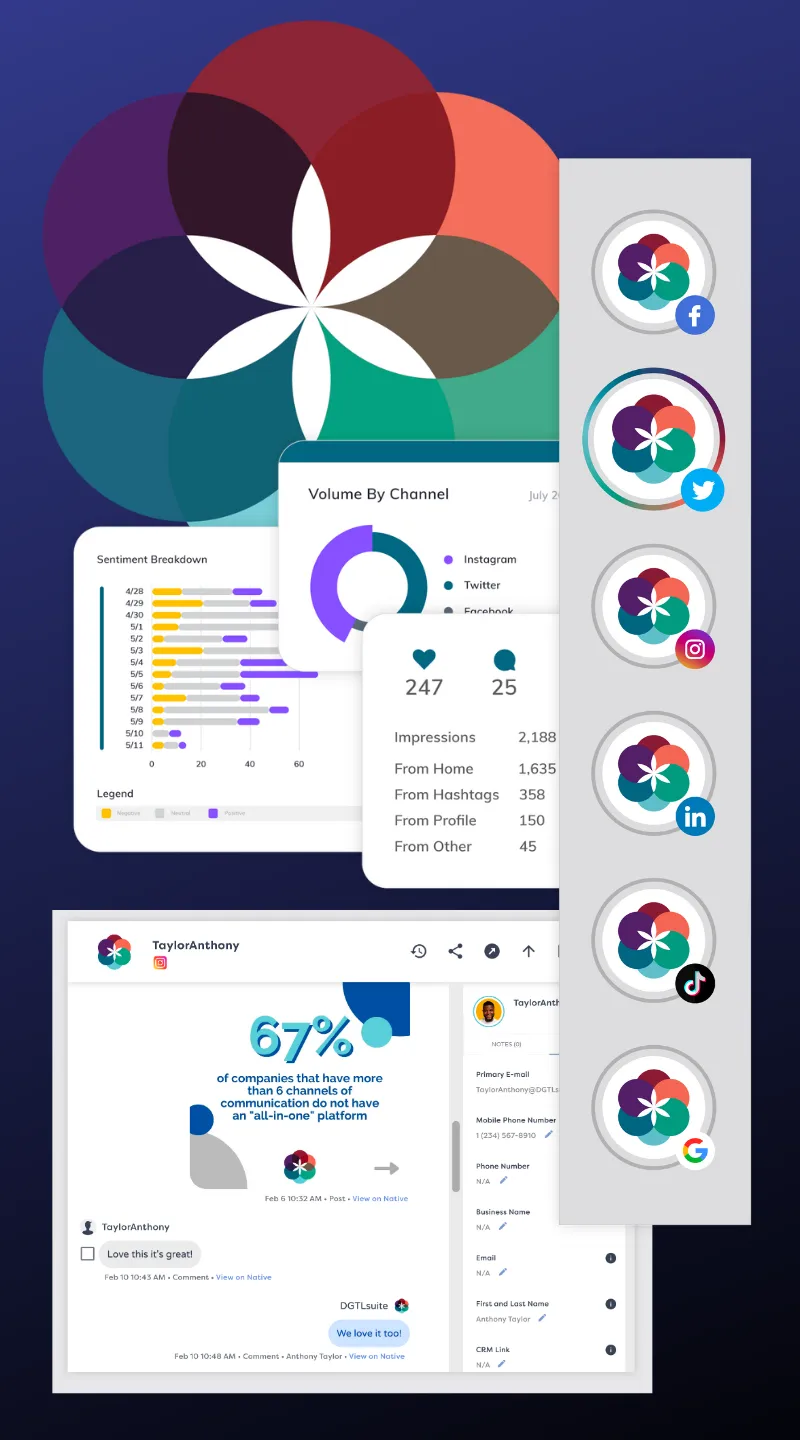
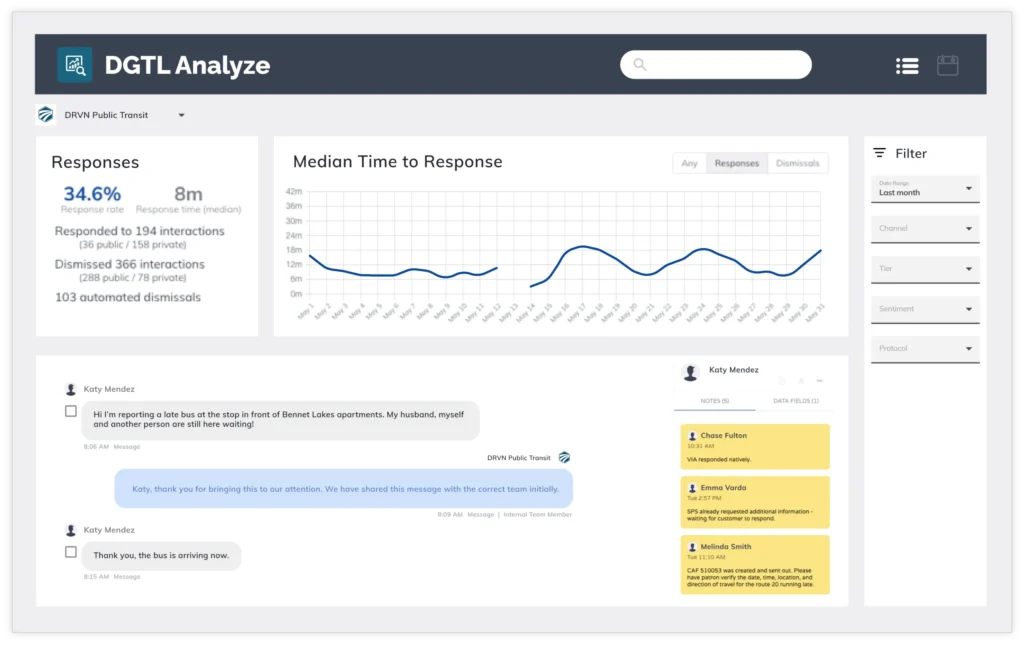
One great option is DGTLsuite, a platform that simplifies engagement analytics while offering powerful features to help you stay ahead. It’s packed with tools to track and analyze your performance without making things overly complicated:
- Real-time tracking: Instantly see how your content is performing, from impressions to conversions.
- Audience insights: Learn more about your audience with detailed profiles and easy-to-read visuals.
- Content optimization: Use content tagging to spot trends and fine-tune your strategy.
- Chatbot training: Train chatbots to handle common questions and improve customer service.
- Integrated social media analytics: Combine engagement data, team performance, and content reports for a full picture.
Find out more–book a discovery call today!
Identify Key Metrics
Once you’ve set your goals and chosen your tools, the next step is deciding which metrics to track. The key is to focus on the numbers that directly tie back to what you’re trying to achieve. Don’t feel like you need to track everything—just stick to the ones that matter most for your goals.
For example, if your main goal is to increase visibility, you’ll want to focus on metrics related to awareness. If you’re aiming to boost engagement or drive conversions, shift your attention to those areas instead.
The list above covers all the essential metrics, so take a moment to pick the ones that align with your strategy.
Here’s a tip: think about what each metric tells you and how you’ll use that information. If a number won’t help you make decisions or improve your approach, it’s probably not worth tracking.
Also, consider your resources—tracking too many metrics can become overwhelming, so prioritize what you can realistically monitor and analyze.
Set a Tracking Schedule
A solid tracking schedule keeps your analytics process running smoothly and makes sure you’re not just collecting data but actually learning from it. The timing you choose should fit your goals and how quickly you need to react to changes.
For general performance monitoring, weekly or monthly reviews are often enough. These give you the chance to spot patterns, see what’s working, and tweak your strategy without feeling overwhelmed.
On the other hand, if you’re running a time-sensitive campaign or testing new content, daily tracking might be the way to go. This allows you to make adjustments on the fly and get the most out of your efforts.
Think of your schedule as part of your strategy, not just a task to check off. Whether it’s once a week or every day, the goal is to stay consistent and intentional.
Analyze Your Data
Analyzing your data is where the magic happens. This step is all about turning raw numbers into meaningful insights that guide your strategy. Instead of just glancing at metrics, take a deeper look to spot patterns, trends, or areas that need improvement.
Start by asking questions: Are some types of posts consistently getting more likes or shares? Does a particular platform bring in higher engagement or conversions? These insights can help you focus on what’s working and fix what’s not.
Don’t just stop at what’s obvious. Dig into the details to uncover gaps. For example, if a post has high impressions but low clicks, it might need a stronger call-to-action. If one platform outshines others, consider allocating more resources there.
Test and Adjust
Testing and adjusting your approach is a crucial part of improving your social media strategy. It’s all about experimenting to see what resonates with your target audience. By trying new ideas, you can uncover what works best and fine-tune your efforts for better results.
Here are a few areas you can experiment with:
- Content types: Try videos, carousels, polls, or infographics to see which format gets the most engagement.
- Posting times: Experiment with posting at different times of the day or week to find when your audience is most active.
- Platforms: Focus on platforms where your audience is most engaged and see if shifting efforts pay off.
- Captions and hashtags: Test different tones or styles in captions and see how various hashtags impact reach and engagement.
- Call-to-action: Experiment with different CTAs to drive clicks, shares, or comments.
The key is to track the results of these tests and use the insights to adjust your strategy. Testing regularly keeps your content fresh and ensures you’re always adapting to what your audience loves.
Automate Where Possible
Manually collecting and organizing data can be a serious time sink. Automating these tasks makes everything so much easier.
Instead of spending hours compiling numbers, you can let a tool handle the busy work while you focus on analyzing and improving your strategy.
Automation also keeps your data consistent and up-to-date. With reports scheduled to arrive automatically and real-time updates always available, you’ll have everything you need without lifting a finger.
Create Reports
Reports help you turn all those metrics into something your team can actually use. By summarizing your findings in a way that’s easy to understand, you can clearly show what’s working, what’s not, and where you might need to adjust.
Keep your reports simple and focus on the key takeaways. Highlight the most important metrics and explain how they relate to your goals. There’s no need to overwhelm anyone with too much detail—just include what’s meaningful and actionable.
Sharing reports regularly keeps everyone informed and on the same page. It helps your team celebrate wins, address challenges, and make smarter decisions moving forward.
Set Benchmarks
Benchmarks give you a way to track progress and see how your strategies are performing over time. With past data as a reference point, you can measure what’s improving, what’s staying the same, and where there’s room for growth. They’re like goalposts that help you figure out if you’re on the right track.
When setting benchmarks, focus on metrics that really matter to your goals. For example:
- Engagement rate: What’s your usual percentage of likes, shares, and comments?
- Click-through rate: How often do people click on your links?
- Follower growth: How many new followers do you usually gain each month?
- Conversion rate: What’s your average success rate for actions like sign-ups or purchases?
- Response time: How quickly does your team typically reply to messages?
- Story completion rate: How many viewers finish watching your stories?
Stay Consistent
Staying consistent is one of the best things you can do for your social media strategy. Regularly tracking your metrics, looking at the results, and adjusting your approach helps you stay in control and ahead of any changes.
If you skip these steps, it’s easy to lose sight of what’s working and miss opportunities to improve.
The trick is to make it part of your routine. Set a schedule to check your performance—maybe once a week for ongoing campaigns or monthly to get a bigger picture. Keeping up with these reviews gives you a clear idea of what’s going well and what could use a little tweaking.
Over time, this steady approach makes managing your social media easier and more effective. Plus, it helps you keep making progress without feeling overwhelmed.
DGTLsuite Lets You Dig Deeper Into Your Data
Feeling overwhelmed by social media data and not sure what’s actually working? Focusing on the right metrics and building a solid workflow can make a huge difference, helping you make smarter decisions and drive real engagement.
But it’s hard to get there without the right tool to keep everything organized and easy to understand.
DGTLsuite makes managing your social media performance easier. With real-time analytics and customizable reports, it helps you understand what’s working and refine your strategy with confidence.
Book your discovery call today and see how it can transform your social media efforts!
FAQs About Engagement Metrics For Social Media
What is the social media engagement metric?
A social media engagement metric measures how users interact with your content. This includes actions like likes, comments, shares, clicks, and other responses that show interest or involvement.
What are good engagement rates for social media?
A “good” engagement rate can vary depending on the platform and industry. As a general rule, an engagement rate between 1% and 5% is considered solid. For highly active audiences or niche markets, rates above 5% are often seen as excellent.
What are engagement metrics?
Engagement metrics are data points that track user interactions with your content on social media platforms. Common examples include likes, shares, comments, click-through rates, and story completion rates. These metrics help gauge how well your audience is connecting with your content.
How is social engagement measured?
Social engagement is measured by tracking specific metrics like likes, comments, shares, and clicks, often divided by impressions or reach to calculate rates. Tools and platforms can automate this process, providing insights into how users interact with your posts.