


Social media success isn’t just about posting pretty pictures or witty tweets; it’s about knowing what’s working and what isn’t. This is where social media metrics come in—they’re the key to understanding if your posts are driving engagement, growing your audience, or simply fading into the background.
Imagine you’re a small business owner launching a new product. You pour hours into creating the perfect Instagram post and wait for orders to roll in… but all you hear are crickets. Frustrating, right?
By analyzing metrics like reach, engagement, and conversion rates, you’d know whether your audience even saw the post, if it resonated with them, and if they were tempted to click through. Metrics give you the power to pivot and improve, turning those crickets into conversations—and conversions.
But don’t worry, it’s not as complicated as it sounds. In this guide, we’re breaking down the most important metrics to track and how to use them to make your social strategy better, smarter, and more effective.
What Are Social Media Metrics And Why Do They Matter?
Social media metrics are numbers and data points that show how well your social media activities are performing.
They give you a snapshot of how people are interacting with your content, how far your message is spreading, and how effective your posts are at achieving your goals—whether that’s increasing brand awareness, maximizing engagement, or driving sales.
Why do they matter? Because without these metrics, you’d be taking shots in the dark.
Metrics give you valuable feedback on what’s working and what isn’t, which allows you to modify your strategy to better connect with your audience. They help you measure the return on investment (ROI) of your social media campaigns, track growth, spot new opportunities, and so much more.
16 Most Important Social Media Metrics
When it comes to understanding how your social media strategy is performing, there are several key metrics to keep an eye on. These metrics help paint a picture of what’s working, what needs improvement, and where to direct your focus for maximum impact.
Here are some of the most important metrics you should track to optimize your social media performance.
Awareness Metrics
Awareness metrics give you a sense of how many people are seeing and talking about your brand. Tracking these numbers can help you gauge brand recognition and the overall reach of your social media content.
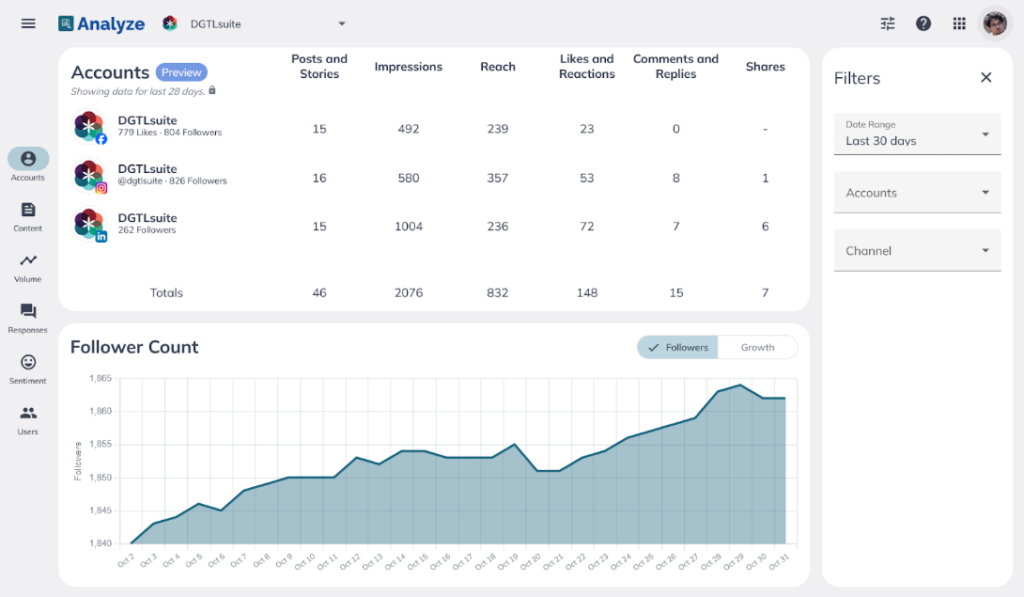
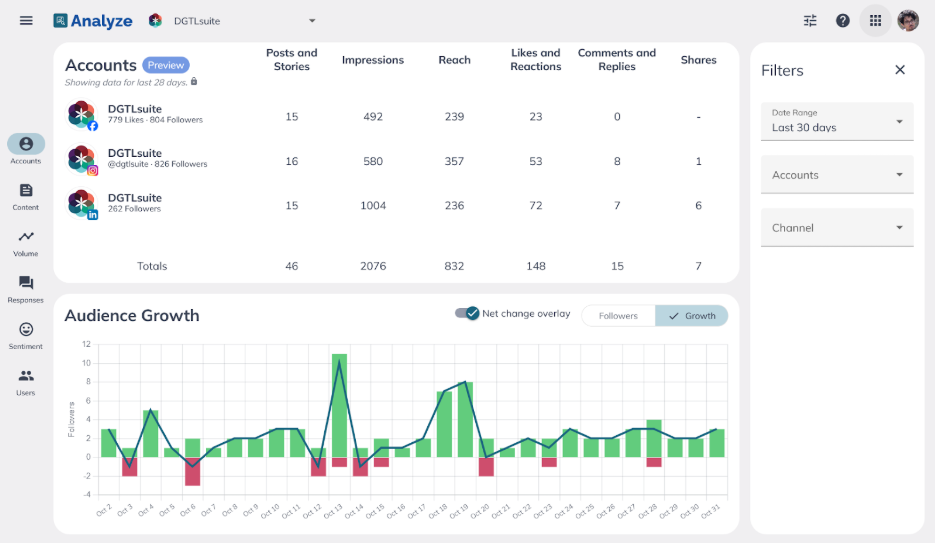
1. Follower Growth
Follower growth is one of the easiest ways to see if your social media strategy is on the right track. If your audience is steadily growing, it’s a good sign your content is connecting with them.
But if things start to slow down—or worse, go in the opposite direction—it might be time to rethink your approach.
You can measure follower growth as a percentage to get a clearer picture. Use this formula:
Follower Growth Rate = (New Followers / Total Followers) × 100
For instance, if you picked up 200 new followers this month and your total follower count is 10,000, your growth rate would be:
(200 / 10,000) × 100 = 2%
Checking this rate every month can reveal patterns and show how well your campaigns are performing. If growth spikes after a certain post or campaign, you’re on the right track. If it stalls, you might need to tweak your content or adjust your posting schedule.
2. Mentions
Mentions are a great way to gauge the buzz surrounding your brand on social media. These occur when someone tags your brand directly or refers to it in a post. Tracking mentions gives you insights into brand awareness and how people feel about your business.
A rise in mentions means your brand is being talked about more frequently—ideally, for positive reasons.
However, even negative mentions are valuable. They give you a chance to engage with your audience, address concerns, and show you’re paying attention. Thoughtful responses to negative mentions can build trust and strengthen relationships.
To monitor mentions effectively, you can use social media analytics tools to track tags, hashtags, and untagged brand references. You can also set up Google Alerts for your brand name to capture mentions outside social platforms.
Regularly reviewing this data helps you measure campaign success, understand audience sentiment, and keep your brand connected to conversations.
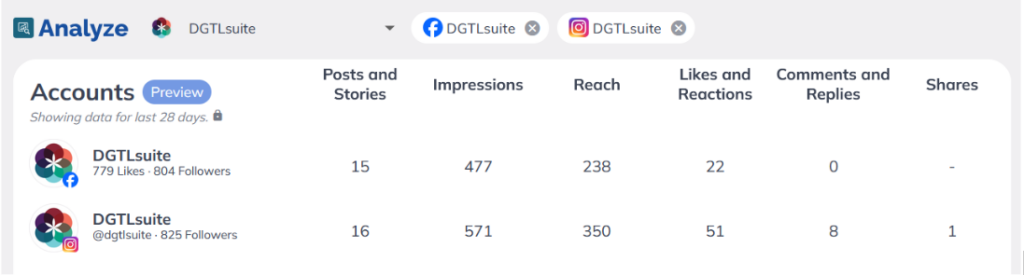
3. Reach
Reach is the total number of unique users who see your content. It’s a clear indicator of how far your message has traveled on a specific social media platform or beyond. In simple terms, it measures the size of the audience exposed to your post.
A high reach is excellent for increasing brand awareness since more people are seeing your content. However, reach doesn’t necessarily mean those people are engaging with it. Your post may appear in their feed without inspiring them to like, comment, or share.
If you notice high reach but low engagement, it’s a sign to revisit your content strategy. This might mean refining your messaging, adjusting your visuals, or better aligning your content with your audience’s interests.
4. Impressions
Impressions track how many times your content is displayed on someone’s screen, regardless of whether they interact with it.
Unlike reach, which counts unique viewers, impressions can count multiple views from the same person. This makes it an important metric for understanding how often your audience is exposed to your content.
A high number of impressions compared to reach indicates your content is being shown repeatedly, which can help improve brand recall. However, impressions alone don’t measure engagement, so it’s best to analyze them alongside metrics like clicks or likes.
What impressions include:
- Posts appearing in user feeds
- Stories viewed multiple times
- Ads displayed on social media platforms
- Content resurfaced through shares or algorithmic suggestions
- Posts shown through hashtags or explore pages
Impressions provide insight into the visibility and frequency of your content to help you understand its exposure. When tracking this metric, you can gauge whether your posts are getting enough visibility and make adjustments to your posting schedule, targeting, or ad strategy if needed.
5. Social Share of Voice
Social Share of Voice (SSoV) shows how much of the social media conversation in your industry is about your brand compared to your competitors.
It’s a great way to see how your brand stacks up in terms of influence and visibility. A higher SSoV means more people are talking about you, which is a strong indicator of brand awareness.
Here’s how to calculate it:
SSoV = (Your Brand Mentions / Total Industry Mentions) × 100
For instance, if your brand gets 500 mentions and there are 5,000 mentions across your industry, your SSoV is:
(500 / 5,000) × 100 = 10%
If you track SSoV regularly, you can spot trends and see whether your brand is gaining ground or being left behind. It also gives you a clear idea of what’s working for your competitors so you can fine-tune your own strategy.
SSoV isn’t just about measuring mentions; it’s about understanding the bigger picture—who’s leading the conversation and why.
Engagement Metrics
Social media engagement metrics show how your audience is interacting with your content beyond just viewing it. Here are some you need to track:
6. Engagement Rate
Engagement rate is a key metric that tells you how well your content resonates with your audience based on interactions such as likes, comments, shares, and more.
A high engagement rate shows that people are genuinely interested and willing to interact with your posts, while a low rate could mean it’s time to rethink your strategy.
It’s worth noting that different social media platforms use various formulas to calculate engagement rates. The basic formula is:
Engagement Rate = (Total Engagements / Total Followers) x 100
However, some platforms, like Instagram, might use impressions as the base, while others may calculate engagement based on reach or total views. Knowing the formula relevant to your social media channel makes sure you’re comparing the right metrics.
7. Virality Rate
Virality rate measures how quickly and widely your content is being shared across social media. While likes and comments are great indicators of engagement, shares take it a step further—they show your content resonates so much that people want to spread it to their own networks.
You can calculate the virality rate with this simple formula:
Virality Rate = (Shares / Impressions) × 100
For example, if your post gets 500 shares and 10,000 impressions, your virality rate would be:
(500 / 10,000) × 100 = 5%
A high virality rate means your content has a strong appeal, which can significantly increase your reach and build brand recognition quickly. It’s especially valuable because shared content is often seen as more trustworthy, coming from peers rather than a brand.
To boost your virality rate, focus on creating shareable content, such as posts that are relatable, emotionally engaging, or packed with valuable information. Adding strong calls-to-action encouraging shares can also help.
Tracking this metric over time gives you insights into what types of content resonate most with your audience and encourages organic growth, which makes it a key part of any social media strategy.
8. Click Through Rate
Click-through rate (CTR) measures the percentage of people who interact with your content by clicking on a link, call-to-action (CTA), or ad. It’s a vital metric for understanding how well your posts are driving traffic to specific pages, such as a product, landing page, or signup form.
You can calculate CTR using this formula:
CTR = (Total Clicks / Total Impressions) × 100
For example, if your post gets 200 clicks and 10,000 impressions, your CTR would be:
(200 / 10,000) × 100 = 2%
A high CTR suggests your content is engaging and your CTA is persuasive. On the other hand, a low CTR could mean your message isn’t resonating, the visuals aren’t appealing, or the CTA isn’t clear enough.
To improve a low CTR, consider testing new approaches, such as rewriting headlines, updating visuals, or making your CTA more direct. Experimenting with placement and timing can also have a big impact.
By monitoring and optimizing CTR, you can create content that captures your audience’s attention and effectively drives them to take action.
9. Video Views and Average Watch Time
Video views and average watch time are two essential metrics for understanding how your social media videos perform. They show not just how many people are watching but also how engaged they are with your content.
Video views track how many times your video has been watched. Most platforms, like Facebook and Instagram, count a view after just a few seconds. A high view count is a good sign that your video is attracting attention, but views alone don’t tell you if people are sticking around.
Average watch time reveals how long viewers stay engaged before moving on. If most of your audience watches the video all the way through, you’re doing a great job holding their interest.
On the flip side, if watch times are low, it could mean the introduction isn’t grabbing attention or the content doesn’t deliver what viewers expect.
Using these metrics together gives a full picture of your video’s performance. If views are high but watch times are short, it might be time to adjust your approach.
Conversion Metrics
Conversion metrics tell you how well your social media efforts are working at turning casual scrollers into customers, subscribers, or anything else you want them to be.
10. Conversion Rate
Conversion rate measures the percentage of people who complete a desired action after clicking on your post. It’s one of the clearest ways to evaluate how effective your content is at driving results.
The formula to calculate the conversion rate is straightforward:
Conversion Rate = (Total Conversions / Total Clicks) × 100
For example, if 50 people converted out of 1,000 clicks, your conversion rate would be:
(50 / 1,000) × 100 = 5%
A low conversion rate might mean it’s time to reassess your messaging, refine your landing page, or adjust your offer to better meet audience expectations.
Examples of conversions include:
- Completing a purchase on your website
- Signing up for a newsletter or webinar
- Downloading a whitepaper or eBook
- Submitting a contact form
- Registering for a free trial or demo
- Clicking to call or chat with your team
With conversion rate tracking, you can pinpoint which content and strategies drive meaningful actions so your social media efforts are aligned with your goals and delivering real results.
11. Cost Per Conversion (CPC)
Cost per conversion tells you exactly how much you’re spending to secure one desired action—whether it’s a sale, sign-up, download, or other conversion goal.
It’s a valuable metric because it sheds light on the efficiency of your marketing budget. If you’re pouring money into a campaign but seeing minimal results, your CPC will tell you it’s time to make adjustments.
To calculate it, use this formula:
Cost Per Conversion = Total Cost of Campaign / Total Conversions
A lower CPC means you’re getting more conversions for the same amount of money, which is always a good thing. It could indicate that your ads are hitting the right people with the right message.
If your CPC is high, though, you may want to refine your targeting, tweak your messaging, or improve the landing page experience to drive down costs and add conversions.
12. Cost Per Thousand Impressions (CPM)
Cost per thousand impressions, or CPM, measures how much you’re spending every time your ad is displayed 1,000 times.
This metric is especially handy for campaigns aimed at increasing brand visibility and getting your message out to as many people as possible. If you’re focusing on making your brand recognizable, CPM is a key number to track.
Here’s the formula:
CPM = (Total Cost of Campaign / Total Impressions) x 1,000
A lower CPM means you’re reaching more people for less money, which can make your campaign more budget-friendly. It’s great for evaluating how cost-effective your ads are at building awareness.
However, while CPM tells you how widely your ads are seen, it doesn’t account for how people interact with them. So, while maximizing impressions is valuable, pairing this metric with engagement or conversion metrics gives a fuller picture of how well your ads are performing overall.
If you find your CPM is on the high side, it may be worth looking at your targeting strategy or experimenting with different content to ensure your message resonates.
13. Bounce rate
Bounce rate measures the percentage of people who visit your page and leave without doing anything else—no clicks, no scrolling, no further exploration. It’s a useful way to see if your landing page matches what visitors expect and holds their interest.
Here’s how you calculate it:
Bounce Rate = (Single-Page Sessions / Total Sessions) × 100
For example, if 400 out of 1,000 visitors leave your page without interacting, your bounce rate would be:
(400 / 1,000) × 100 = 40%
A high bounce rate could mean your page isn’t delivering what visitors hoped to find or it’s not engaging enough to make them stick around. It might be due to slow load times, confusing design, or content that doesn’t match your post’s promise.
To fix this, make sure your landing page aligns with the message that brought visitors there. Keep it simple, engaging, and optimized for mobile. Adding interactive elements like videos or clear CTAs can also help keep people interested.
Customer Service Metrics
Customer service and satisfaction metrics let you know how happy (or not-so-happy) your customers are with your brand. Keeping tabs on these numbers can give you a clear sense of what you’re doing right and where there’s room to improve.
14. Customer Satisfaction Score (CSAT)
CSAT is a straightforward way to measure customer happiness. Typically, customers are asked to rate their satisfaction with your product or service on a scale, like 1 to 5 stars or a percentage score.
It’s easy to gather through surveys or follow-up emails. Here’s the basic formula:
CSAT = (Total Positive Responses / Total Responses) x 100
A high CSAT score shows you’re keeping customers happy. If it’s dipping, it might be time to dig into what’s driving dissatisfaction.
15. Brand Sentiment
Brand sentiment measures how people feel about your brand by analyzing online comments, reviews, mentions, and conversations.
It goes beyond tracking the number of mentions and focuses on the tone—whether people are expressing positive, negative, or neutral feelings about your brand. Quantifying brand sentiment involves analyzing these mentions and categorizing them to determine the overall sentiment balance.
One common approach to quantifying brand sentiment is through a sentiment score:
Sentiment Score = ((Positive Mentions – Negative Mentions) / Total Mentions) x 100
A high score indicates more positive sentiment, while a low score suggests negative sentiment is dominating. Tracking changes in this score over time allows you to understand shifts in public perception and address issues before they escalate.
Automated tools often use natural language processing (NLP) to categorize and score sentiment to give you quick and measurable insights into how your brand is perceived online.
16. Customer Reviews
Customer reviews provide unfiltered feedback directly from your users, offering valuable insights into how your products or services are perceived.
Positive reviews can boost your brand’s reputation and attract new customers, while negative ones highlight areas for improvement. Engaging with reviews—especially the negative ones—demonstrates that you’re attentive and care about customer satisfaction, which can strengthen trust and loyalty.
How to collect customer reviews on social media:
- Post review requests: Regularly ask your followers for feedback on posts or stories. Encourage them to share their experiences in comments or direct messages.
- Add polls or surveys: Use built-in tools like Instagram Stories polls or LinkedIn surveys to gather quick feedback.
- Respond to mentions: Engage with users who mention your brand, encouraging them to leave a detailed review or testimonial.
- Use review widgets: Link to review platforms like Facebook Recommendations or Google Reviews directly from your profile.
- Incentivize reviews: Offer discounts, freebies, or exclusive content in exchange for honest reviews, ensuring transparency about the incentive.
Leverage hashtags: Create a branded hashtag and ask customers to use it when posting about your product or service, making their reviews easy to find.
Best Ways to Use Social Media Metrics to Improve Your Strategy
Social media metrics offer valuable insights that can help fine-tune your strategy and make it more effective. Here are some of the best you can put these metrics to work:
Identify What Works (and What Doesn’t)
Metrics like engagement rates, reach, and impressions help you see what content resonates most with your audience.
If a particular social media post gets a lot of likes, shares, or comments, it’s a clear sign that your audience likes that type of content.
On the flip side, if a post receives little to no engagement, it might be time to rethink your approach. Use this data to focus more on what works and scrap what doesn’t.
Refine Your Target Audience
Social media metrics can reveal valuable details about who is interacting with your content and when they’re most active.
Demographic data, such as age, gender, and location, along with engagement patterns, can help you better tailor your messages, target your ads more effectively, and schedule posts at the right times to maximize reach and engagement.
Track Progress Toward Goals
Metrics like follower growth, conversion rates, and click-through rates allow you to measure how close you are to hitting your social media goals.
By regularly reviewing these numbers, you can quickly see if you’re on track or if your strategy needs a course correction. This helps you stay focused on results rather than getting lost in vanity metrics.
Maximize Engagement
If you notice that your engagement rate is lower than expected, consider experimenting with different types of content, such as:
- Videos
- Stories
- Polls
- Interactive Q&A sessions
- Infographics
- User-generated content (UCG)
Engaging directly with your audience through comments, likes, and replies can also encourage more interaction and build a sense of community around your brand.
Optimize for Conversions
Conversion metrics, like conversion rates and cost per conversion, show you how effective your campaigns are at driving desired actions, such as sales, sign-ups, or downloads.
If these numbers aren’t where you want them to be, analyze what might be causing drop-offs. It could be an unclear call-to-action, a poorly designed landing page, or messaging that doesn’t quite match what users expect.
Manage Brand Sentiment
Tracking brand sentiment and customer reviews gives you valuable insight into how people feel about your brand. Are conversations mostly positive, or are there negative trends to address?
When you listen and respond thoughtfully to customer feedback, you can shape public perception, resolve issues, and show that you genuinely care about your audience.
Improve Cost Efficiency
Metrics like cost per thousand impressions and cost per conversion help you understand if your social media marketing spend is delivering value.
If you’re paying too much to reach people or convert them, try adjusting your targeting parameters, refining your ad messaging, or experimenting with different bidding strategies to lower costs and maximize results.
For example, if your cost per conversion is high on a Facebook ad targeting a broad audience, you could narrow it down to a specific age group or interest that aligns with your product.
This refined targeting can lead to more relevant clicks and reduce your overall costs, so you can make your ad spending more efficient.
Experiment and Iterate
The world of social media changes fast. What works today might not work tomorrow. Regularly testing new content types, messaging strategies, and ad formats while keeping an eye on the metrics allows you to stay agile.
Use the data from your tests to make adjustments and keep your social media strategy fresh and effective!
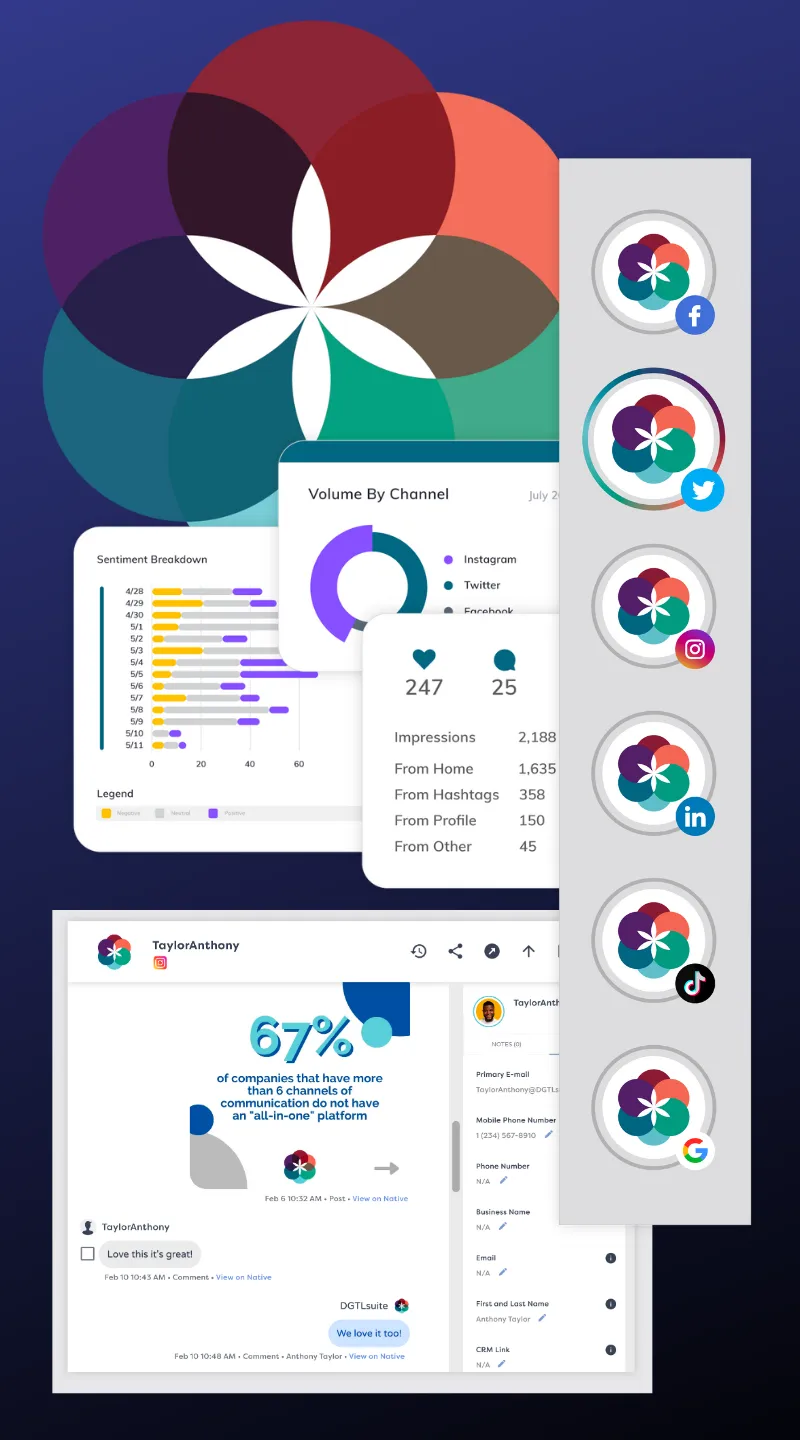
How DGTLsuite Can Make Social Media Analytics Easy
DGTLsuite takes the headache out of social media analytics by transforming complex data into clear, actionable insights. It helps you connect with your audience better and make smarter business decisions.
Here’s why it’s a huge investment for any social media manager:
Real-Time Tracking Made Simple
With DGTLsuite’s real-time social media analysis tools, you don’t have to wait to see how your campaigns are doing. You can watch your results roll in live and make tweaks on the fly.
Whether you’re looking to attract more followers, improve engagement, or convert clicks into customers, being able to see what works and what doesn’t right away is a game changer.
Plus, you can manage all your social media channels in one place, so no more switching in between.
Get to Know Your Audience
DGTLsuite makes understanding your audience easy. By using its data labeling and profiling features, you can store and organize customer info in digital profiles tailored to your needs.
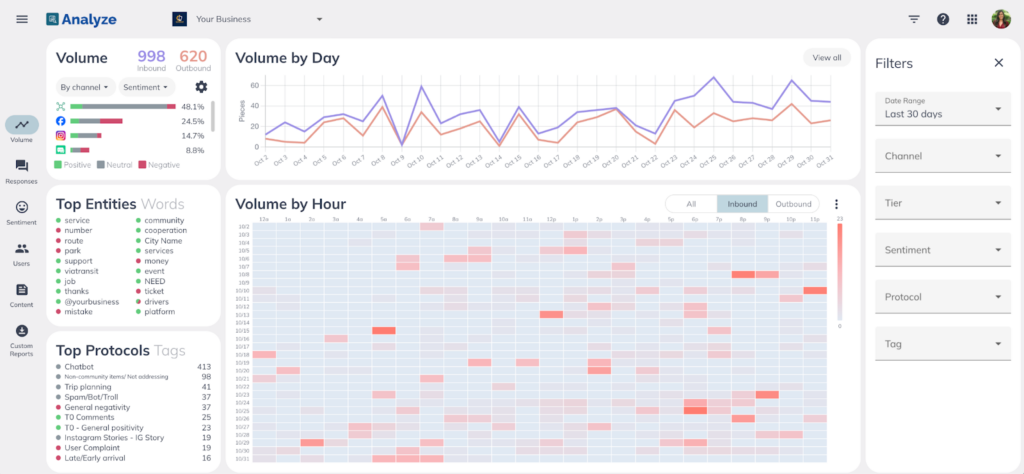
All of this data is displayed in simple visuals that show trends like peak engagement hours and response times. It’s like having a cheat sheet for knowing exactly when and how to engage with your audience.
Automate Your Customer Service
DGTLsuite doesn’t stop at analytics; it helps streamline your customer service, too. You can train chatbots and taskbots to handle common customer questions, speed up responses, and make life easier for everyone.
When things get a bit tricky, these bots can seamlessly hand off conversations to live agents, keeping your customers happy and your service smooth.
Make Content That Sticks
With DGTLsuite’s content tagging and analytics features, you can easily see what social media posts and campaigns are knocking it out of the park. When you keep an eye on what your audience loves, you can fine-tune your content strategy to focus on what actually works.
No more guessing—just more engagement.
Smarter, Data-Driven Decisions
DGTLsuite gives you a full view of your social media impact, from engagement rates and content performance to team response times. This kind of all-in-one data insight means you can make decisions based on facts, not just hunches, giving your business the edge it needs.
Not only that, but DGTLsuite can manage your content on multiple social media channels, control all your digital conversations in one place, collaborate easily with your teammates, and so much more.
Schedule a discovery call today and learn why it’s the perfect all-in-one social media tool for your business!
FAQs About Analyzing Social Media Metrics
How do you analyze social media metrics?
To analyze social media metrics, start by identifying your goals, such as increasing engagement, driving traffic, or boosting conversions. Focus on relevant metrics like reach, impressions, engagement rate, and conversion rate. Use analytics tools like DGTLsuite, Hootsuite, or native platform insights to track and interpret the data, compare it against benchmarks, and adjust your strategy based on what’s working.
What are 5 ways to measure social media performance?
Measure social media performance by tracking follower growth to assess audience expansion, engagement rates to see how people interact with your content, reach to understand visibility, conversion rates to evaluate results, and customer sentiment to gauge how your audience feels about your brand.
How do you analyze social media data?
Analyzing social media data involves collecting metrics like clicks, shares, and impressions from analytics tools, organizing the data to identify trends, and evaluating performance against goals. Look for patterns, such as which content performs best, and use those insights to refine your social media strategy.
What are the 4 metrics used to track and analyze social media activities?
Four common metrics include reach (how many people see your content), engagement rate (interaction levels like likes and shares), click-through rate (link clicks from your posts), and conversion rate (actions taken after engaging with your content).